Economy · Trade
Exports, imports, the Freeport, commodity flows, and Liberia’s position in regional trade.
36 stories matched from the TrueRate newsroom.
CBL Statistical Data · Balance of Payments
Goods trade balance (LBR_BOP_1_4) with export and import flows. Quarterly series, million USD.
Chart showing Liberia goods trade balance over 20 quarters. Most recent: $27.7M.
Source: Central Bank of Liberia DataWarehousePro · Updated nightly
forex
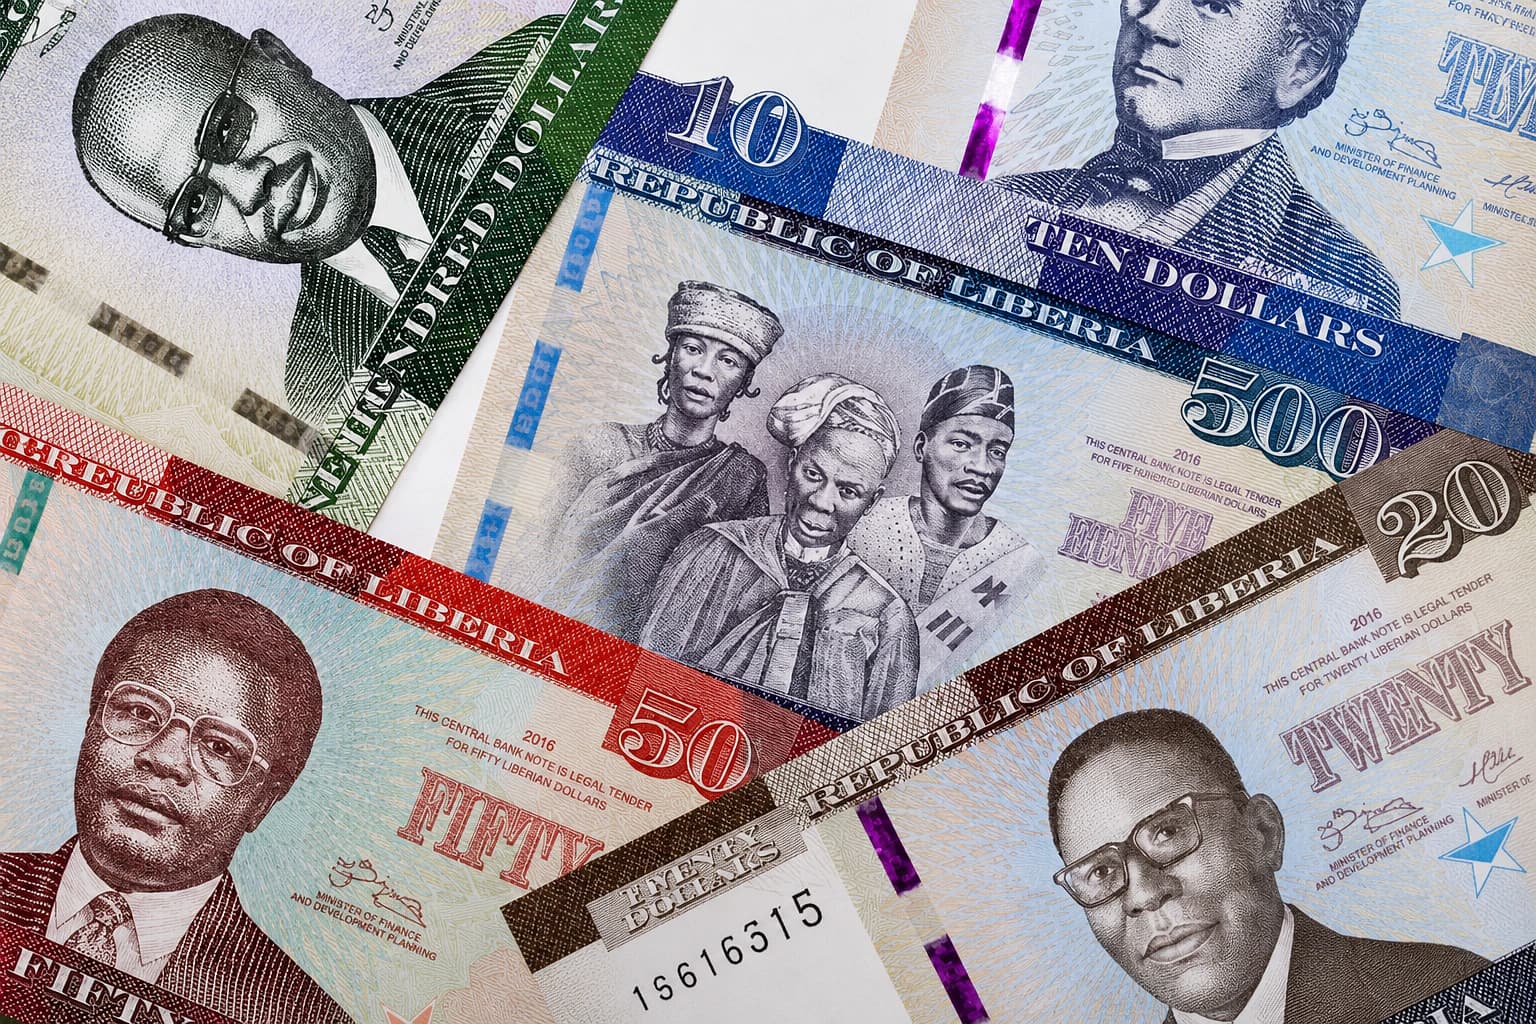
The exchange rate fell 7.92% over the past year to L$183.93 per US dollar in March 2026, according to CBL data. For importers, the stronger currency means cheaper goods in local terms. For exporters and dollar-earners, it means thinner margins — a split that runs through every business that touches both currencies.
commodities
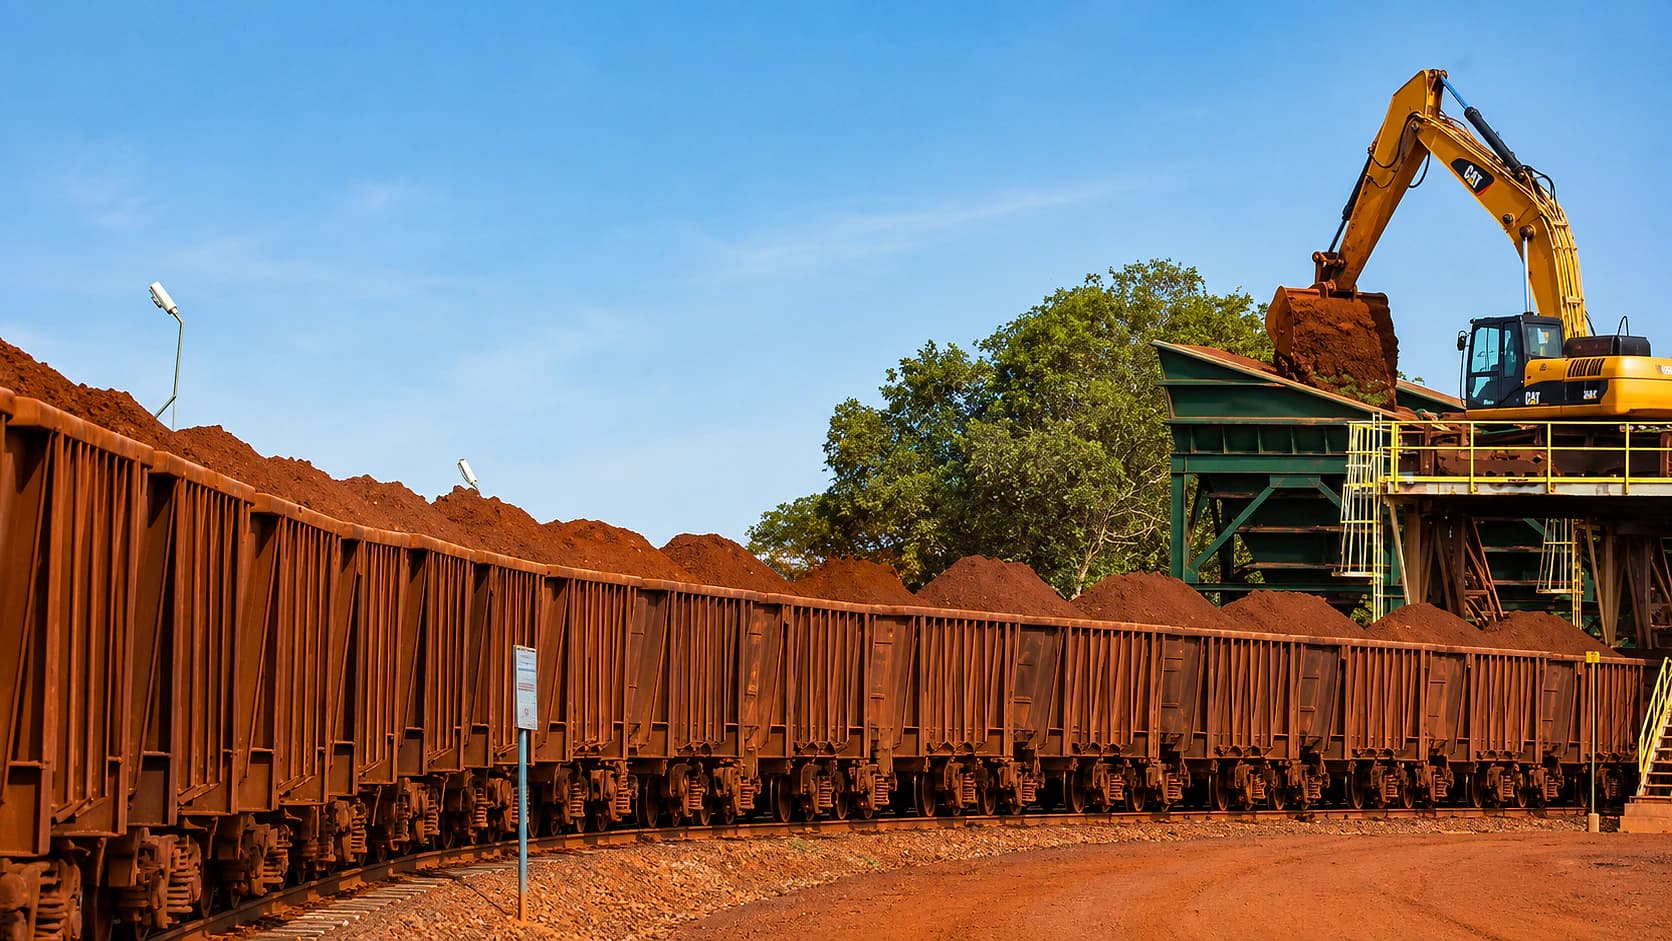
Gold exports reached US$175.13 million in March 2026, up 111.87% year-on-year, and now account for 66.52% of total monthly exports, according to CBL data. Combined with iron ore, two commodities make up 92.59% of export earnings — a level of concentration that turns a single global price move into a national-accounts event.
business
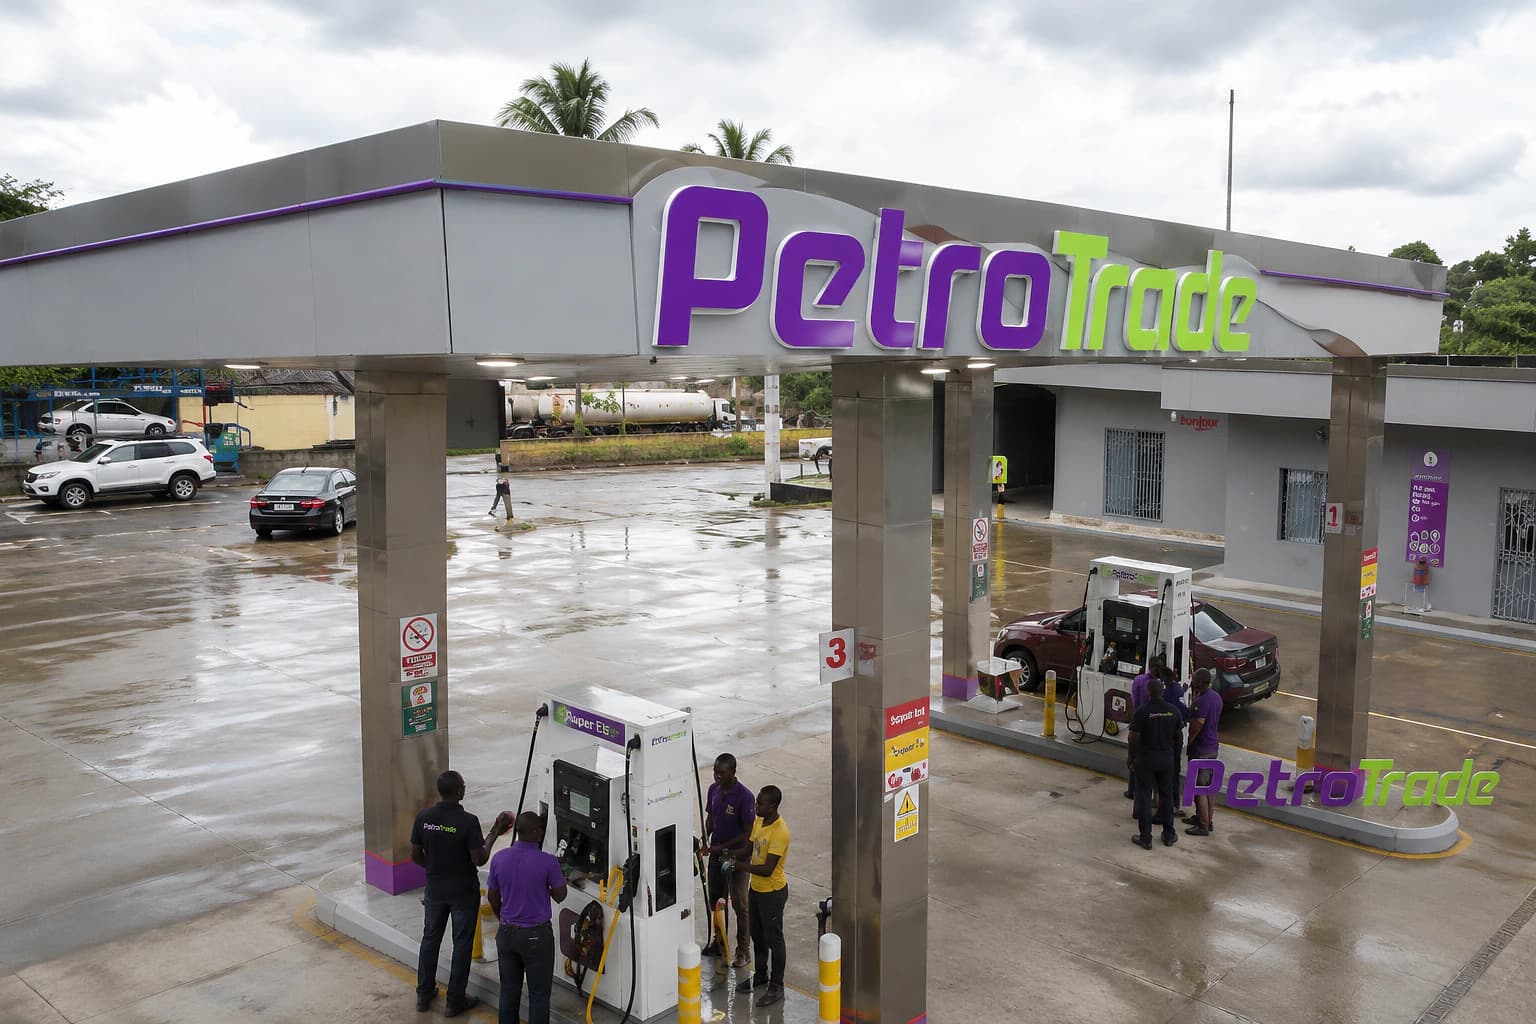
The imported fuel price index rose 12.38% in March 2026 to its highest level in two years while the headline consumer price index climbed just 0.62%, according to LISGIS. For keke operators, market traders, and delivery businesses, the gap between official inflation and daily operating costs is the widest it has been in at least two years.